My April 2023 On failed IT projects post did not address the political aspects of large scale IT system acquisition’s. The post is inspired by Dr. Brenda Forman’s chapter on the political challenge found in the book The Art of System Architecting, third edition, a book that is highly recommended.
The book addresses architecting of systems, and since a firms information technology, it be in the private or public sector is a system the systems architecting approach is applicable. For information technology to make any sense its structure must support the firm’s overall mission.
Politics as design factor
The bottom line is: If the politics don’t fly, the system never will. This is the case for any kind of system or technology program that require government funding. From a Norwegian perspective the National Transport Plan is a good example. Projects are moved up and down dependent of political climate. No project on the plan is safe before the funding is in place.
Architects must be able to think in political terms. According to Dr. Forman this mean to understand that political processes follows an entirely different logic than the logic applied by scientists and engineers. Scientists and engineers are trained to marshal their facts and proceed from facts to conclusion.
Political thinking is different, it do not depend on logical proof, but on past experience, negotiation, compromise, and perceptions. Proof is the matter of having the votes. If the majority of votes can be mustered in the parliament the project has been judged to be worthy, useful and beneficial for the nation.
Mustering the votes depends only in part of engineering or technological merit. These are important, but to get the votes on a regular basis depends more on jobs and revenues in electoral districts than technological excellence. It might be more important for an elected representative to have a project that keep local construction contractors engaged for the next five years than the value from the traffic on the road when its completed.
To help architects navigate the rocky political landscape the following heuristics or as they are called in the book, The facts of life:
Politics, not technology, sets the limits of what technology is allowed to achieve.
Cost rules.
A strong, coherent constituency is essential.
Technical problems become political problems.
The best engineering solution are not necessarily the best political solution.
Another observation is that political visions don’t fly without feasible technology and adequate funding. Example: In 2007 Norwegian prime minister Jens Stoltenberg uttered the following in his new year’s speech:
Our vision is that within 7 years we will have in place the technology that make it possible to capture carbon from a power plant.This will be an important break through for Norway and when we succeed the world will follow. This is a big project for the country. It’s our moon landing.
Sixteen years later; the technology does not exist and nobody talks about it. In the end there were no constituency, no funding and no politics to make it happen. The problem with such political dreaming is that it diverge effort and resources from things that could have been done, the small steps of improvement that over time could make a difference.
More troublesome are funded initiatives where the political accepted solution does not solve the operational problem at hand. My first encounter with such situation was back in 1990. A part of Norwegian government should spend a billion NOK (a heck of a lot of money) on computers without having a clue about the software to be run on those computers.
Enterprise information systems find themselves in an ill-structured and even complex problem world. Ill-structured problems are problems where the users don’t understand their needs before they see a solution. Complex problems implies that its deduct a solution from an analytical process. The only practical way to solve such problems is by experimentation. More on that can be found here.
Systems architecting in political sensitive environments is an act of balancing conflicting complex systems. Political processes are complex in their own way and the same said about the operational context shown in figure 1 below.
Figure 1: Systems architecting – an act of balancing conflicting interests
Be aware that the end-users who live their lives in the operational context are not the same as the client paying for the solution in the political context. This is definitively the case in the public sector and its often the case in larger enterprises. To showcase the point lets explore a real world case that has run into trouble.
Case
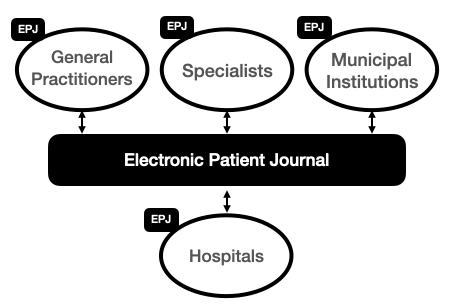
Helseplattformen, is a large scale, highly complex health care IT project that according to the press suffers from cost overruns, delays and severe quality issues. Helseplattformen decided to acquire a commercial product from Epic Systems for what under any circumstance is a ambitious functional scope. A shared patient record across hospitals, general practitioners, specialists and municipal institutions in one of Norway’s health regions.
Reported problems included lost data, record lockings, cumbersome user interfaces and general instability, all leading to patient safety concerns. The fact that users in Denmark, UK and Finland had faced severe problems priory to the Norwegian acquisition make the situation even more dire. It shows that political processes might be ignorant to the facts on the ground. As the old proverb states:
Wise men learn from other mens mistakes, fools from their own.
The timeline (below) tell a story about a classical waterfall approach where potential issues are pushed to the end of the project, to first use when the cost of change is at its highest.
2015 – pre-project started
2017 – acquisition project started
2019 – contract signed with Epic Systems after tendering
2020 – lab module implemented but postponed due to Covid-19 pandemic
2021 – municipalities joining after political decisions
2022 – first use set to April, problems materialise
2023 – problems continue
The project stand out as a schoolbook example of how to fail, leading to the question what could have been done differently? Firstly, capture the essence of the problem in a context map (figure 2) and develop a firm problem statement. Secondly develop alternative options and assess them. Finally, choose the best option, typically the one that is least intrusive and risky to implement.
Figure 2: Context map
Assessment
Given that electronic health care records has been used for decades, all parties have working solutions today. The problem on the table is to create a EPJ that is shared across all parties. Such EPJ can be achieved in two principal ways.
Acquire a new integrated system and enforce it on all parties
Isolate the shared EPJ and integrate applications using API’s
Helseplattformen opted for alternative #1 by choosing an integrated solution from a vendor. Alternative #2 can be realised in two principle ways. By using a federated model according to the EU Data Spaces approach, or by using a centralised model according to the library model. Alternative #1 is tightly coupled and intrusive. Alternative #2 is loosely coupled and nonintrusive.
It is understandable that an integrated system from one vendor looks tempting for decision makers. From 35000 feet Epic Systems with a 78% US market share feels as a safe bet, but transporting a product made in one operational context to a complete new context driven by a complete different vision is most often a painful exercise. The only available approach to dig out the differences between is by paid up-front testing and evaluation of the product before any decision is made.
Products
Products, commercial or open-source is the key to cost efficient realisation of enterprise information systems. Products come in three forms. Large scale integrated products as Epic Systems and SAP. End user productivity tools such as MS Office and Google Docs, and technical components, libraries that are used by developers, they being in the enterprise or in the product space.
The crux with any product is the context that created them in the first place. A product developed for a specific context might be very hard to transport to a similar context in a new market. The larger and complex the product is, the worse it becomes. Therefore the only practical approach is to test before any decision is made. This is time consuming and expensive, but there are no short cuts when dealing with the complexity of mission critical enterprise information systems.
Conclusion
Politics rule information system acquisition processes and the only way to balance out political ambitions with operational excellence is systems architecting. Helseplattformen shows that enterprises need to strengthen their information technology system architecting capability and make it part of their business strategy function. As digitalisation become more and more important the need for digital savvy board members become evident.
Enterprise architects must move out of IT and start serving the business. To do so the enterprise architects must develop design skills and master richer modelling tools and approaches as described in my previous blog post on Object-Oriented Enterprise Architecting and in the next post titled on the essence of system design. It also mean to to work the political and technical realms equally.
An to help us remember why up-front systems architecting is important, lets quote Plato, 400BC.
The OSDU™ Data Platform is the most transformative and disruptive digital initiatives in the energy industry. Never before have competitors, suppliers and customers joined forces to solve a common set of problems taking advantage of open-source software licensing, agile methods and global collaboration.
Originally OSDU was an acronym for Open Subsurface Data Universe, directly derived from Shell’s SDU (Subsurface Data Universe) contribution. There is great video presenting Shell’s story that can be found here. The OSDU™ Forum decided to remove the binding to the subsurface and to register OSDU as trademark owned by The Open Group paving the way for adaptation beyond subsurface, enabling constructs like:
OSDU™ Forum – the legal framework that govern community work
OSDU™ Data Platform – the product created by the forum
The OSDU™ Forum’s mission is to delivers an open-source, standards-based, technology-agnostic data platform for the energy industry that:
stimulates innovation,
industrialises data management, and
reduces time to market for new solutions
The mission is rooted in clearly stated problems related to digitalisation of energy and the journey till today is summarised below:
2016 – 2017
Increased focus on digitalisation, data and new value from data in the oil and gas industry
Oil and gas as companies make digital part of their technology strategies and technical roadmaps
2018-2019:
Shell invites a handful oil and gas companies to join forces to drive the development of an open source, standardised data platform for upstream O&G (the part the find and extract oil and gas from the ground)
The OSDU™ Forum was formally founded in September 2018 as an Open Group Forum based on Shell’s SDU donation as the technical starting point
Independent software companies, tech companies and cloud service providers join. Bringing the cloud service providers onboard was a strategic aim. Without their help commercialisation would become more difficult
July 2019: SLB donates DELFI data services, providing additional boost to the forum.
2020-2021:
Release of the first commercial version – Mercury from a merged code base is made available by the cloud service providers for consumption
2022 and beyond
Operational deployments in O&G companies.
Hardening of operational pipelines and commercial service offerings (backup, bug-fixing)
Continuous development and contribution of new OSDU™ Data Platform capabilities.
The OSDU™ Data Platform was born in the oil and gas industry and it is impossible to explain the drivers without a basic understanding of the industrial challenges that made it, challenges that come from earth science and earth science data.
Earth science
Earth science is the study of planet Earth’s lithosphere (geosphere), biosphere, hydrosphere, atmosphere and their relationships. Earth science forms the core of energy, it be oil and gas, renewables (solar, wind and hydro) and nuclear. Earth science inherently complex because it’s trans-disciplinal, deals with non-linear relationships, contain known unknowns, even unknowable’s, and comes with a huge portion of uncertainty.
Hydrocarbons forms in the upper part of earth’s lithosphere. Dead organic material is transported by rivers to lakes where it sink and is turned into sediments. Under the right conditions the sediments become recoverable hydrocarbons by processes that takes millions of years. In the quest for hydrocarbons geo-scientists develop models of earths interior that help them to predict where to find recoverable hydrocarbon.
Earth models
Earth models sits at the core of the oil and gas industries subsurface workflows and are used to find new resources, develop reservoir drainage strategies, investment plans, optimise production and placement of new wells. Earth models are used to answer questions like:
How large hydrocarbon volumes exists?
How is the volume placed in the reservoir?
How much is recoverable in the shortest possible time?
As reservoirs empties, where are the remaining pockets?
How much has been produced, from when, and how much remains?
How to drain the volumes as cost efficient as possible?
Earth models are developed from seismic, observations (cores, well logs and cuttings) and produced volumes. When exploring new areas access to relevant datasets is an issue. Exploration wells are expensive and finding the best placement is important. Near-field exploration is easier as the geology is better known. Some production fields use passive seismic monitoring allowing continuous monitoring of how the reservoir changes while being drained. Another approach is 4D seismic, where new and old seismic images are compared.
Seismic interpretation means to identify geological features such as horizons and faultsand to place them at the appropriate place in a cube model of the earth. How this is done is shown in this 10 minute introduction video.
The pictures to the left shows a seismic image. To derive useful information requires special training as it is a process of assumptions and human judgement. To the right a picture of log curves and for more information about well logging please read this. Seismic datasets are very large and relatively expensive to compute. Well logs are smaller in size, but they come in huge numbers and choosing the best one for a specific task might be a time consuming process.
Timescales
Oil and gas fields are long-lived and the longevity represents a challenge on its own that is best illustrated using an example. The Norwegian Ekofisk field, discovered in 1969, put on stream in 1971, and expected to produce for another 40 years. The catch being that data acquired with what is regarded state of art technology will outlive the technology. Well logs from the mid sixties, most likely stored on paper are still relevant.
Adding to the problem is the changes in measuring method and tool accuracy. This is seen when it comes to metrological data. Temperature measured with a mercury gauge come with an accuracy of half degree celcius. Compare that with the observed temperature rise of one degree over the last hundred years. Being able to compare apples with apples become critical and therefore is additional sources of data required.
When the storage technology was paper this was one thing, now when we storage has become digital its something else. For the data to be useful a continuous reprocessing and re-packeting is required.
Causal inference
Subsurface work, as other scientific work is based on causal inference i.e., asking and answering questions attempting to figuring out the causal relationships in play.
The Book of Why defines three causation levels seeing, doing and imagination as illustrated by the figure below.
Source: The Book of Why
Seeing implies observing and looking for patterns. This is what an owl do when it hunts a mice, and it is what the computer does when playing the game of Go. The question asked is; what if I see… eluding to that if something is seen it might impact the probability for something else to be true. Seismic interpretation begins here with asking where are the faults while looking at the image.
Doing implies adding change to the world. It begins by asking what will happen if we do this? Intervention ranges higher than association because it involves not just seeing but changing what is. Seeing smoke tells a different story than making smoke. Its not possible to answer questions about interventions with passively collected data, no matter how big the data set or how deep the neural network. One approach to do this is to perform an experiment, observing the responses. Another approach is to build a causal model that captures causal relationships in play. When we drill a new well that can be seen as an experiment where we both gather rung one data, and also discover rung 2 evidence related to what work and what does not work. The occurrence of cavings and a potential hole collapse being one example.
A sufficient strong and accurate causal model can allow us to use rung one (observation) data to answer rung two questions. Mathematically this can be expressed as P(cake | do (coffee)) or in plain text, what will happen to our sales of cake if we change the price of coffee.
Imagination implies asking questions like my headache is gone, but why? Was it the aspirin I took? The food I ate? These kind of questions takes us to counterfactuals, because to answer them we must go back in time, change the history and ask, what would have happened if I had not taken the aspirin? Counterfactuals have a particularly problematic relationship with data because data is by definition facts. Having a causal model that can answer counterfactual questions are immense. Finding out why a blunder occurred allow us to take the right corrective measures in the future. Counterfactuals is how we learn. It should be mentioned that laws of physics can be interpreted as counterfactual assertions such as “had the weight on the spring doubled, its length would have doubled” (Hooke’s law). This statement is backed by a wealth of experimental (rung 2) evidence.
By introducing causation the value of useful data should be clear. Without trustworthy data, that we are not able to agree about what we can see, there cant be any trustworthy predictions, causal reasoning, reflection and action. The value of a data platform is that it helps with the data housekeeping at all levels. Input and output from all the three rungs can be managed as data.
Causal models are made from boxes and arrows as illustrated in the figure below. How the factors contributes can be calculated as probabilities along the arrows. The beauty of causal models is that their structure is stable, while the individual factors contribution will change. Loss mean that mud leaks into the formation due to overpressure, and gain implies that formation fluids leaks into the wellbore. Both situations are undesired as they might lead to sever situations during drilling.
Finally, dynamic earth modells based on fluid dynamics captures causal relationships related to how fluids flow in rock due to the laws of physics.
Digitalisation
Until less than 60 years ago earth models as most other models was paper based. With the development of computers earth models have become digital with raw data and derived knowledge carved into software and databases.
Despite digital tooling earth science work practice has not changed much. Scientists collects data, build models and hypothesis, analyse and predict possible outcomes.
One thing that has changed is the amount of data. The dataset shared by Equinor for the retired Volve field consists of 40.000 files. Volve was a small field producing for a decade. To know what dataset can / should / could be used for what type of work is not trivial.
Another challenge is that each discipline has its own specialist tools emphasising different aspects of the dataset. This mean that two disciplines will struggle to synthesise their results at the end. Adding to the challenge the fact that models are tied to the tool and the individual users preferences and understanding.
The result is an individ centred, discipline specific tooling that make a holistic (trans disciplinary) view difficult if at all possible. Said in other words: we have tools the forest, tools for the threes and tools for the leaves, but no tool that allow us to study threes in context of the forest or leaves in context of a three. Philosophically speaking is this the result of applying reductionism on a complex problem.
The effect is fragmentation and inconsistency across individuals, tools, disciplines and organisational units leading to loss of knowledge, loss of trust and continuously rework as people struggle to build on each others work.
Fragmentation is a good starting point for the next topic that create a lot of pain when building digital data models, the question of what is one thing and when does a thing change so much it become a new thing.
One thing
According to William Kent in Data and Reality answering what is one thing forces us to explore three key concepts:
Oneness. What is one thing?
Sameness. When we say two things are the same, or the same thing? How does change affect identity?
Categories. What is it? In what categories do we perceive the thing to be? What categories fo we acknowledge? How well defined are they?
Oneness underlies the general ambiguity of words and we will use an example from the book regarding the word “well” as used in the files of an oil company.
In their geological database, a “well” is a single hole drilled in the surface of the earth, whether or not it produces oil. In the production database, a “well” is one or more holes covered by one piece of equipment, which has tapped into a pool of oil. The oil company had trouble integrating these databases to support a new application: the correlation of well productivity with geological characteristics.
This imply that the word well is ambiguous across contexts. Observe that the ambiguity lays with the understanding of the concept well. The production database might have used the term well for what a geologist might think of as a wellbore.
What we observe here is ambiguity across contexts. The production database might have used the term well for what a geo-scientist might think of as a wellbore. Reading along we find this:
As analyst and modellers, we face “oneness”, “sameness” and “categories”. Oneness means coming up with a clear and complete explanation of what we are referring to. Sameness means reconciling conflicting views of the same term, including whether changes (and what type of changes ) transform the term into a new term. Categories means assigning the right name to this term and determining whether it is an entity type, relationship, or attribute on a data model. Oneness, Sameness and Categories are tightly intertwined with one another.
The main takeaway from this is that the ambiguities that we find in a trans-disciplinary fields such as earth science will create problems if not properly addressed. These ambiguities has more to do with how disciplines thinks and express themselves than finding a digital representation. The challenge sits with the semantics of language.
The value of standardising terminology is seen in medicine and anatomy where every piece of the human body is given a latin name that is thought and used across disciplines.
Contextualisation
Domain Driven Design provide two architectural patterns; Bounded Context and Context Mapping that help software architects and data modellers to create explicit context and context relationships. Bounded contexts and context maps allows architects to practice divide and conquer without loosing the whole. Reconciling might prove to be much harder than first thought. The picture below shows practical use of how bounded contexts can be applied on the well problem described above.
By modelling the two applications as bounded context it become clear that reconciliation will require use of a new context as forcing one applications definition on the other will not work. Therefore is it better to create a new bounded context that reconcile the differences by introducing new terminology.
The role of a data platform
A data platforms store, manage and serve data to consumers while adhering to the governance rules defined for the data. A data platform is not a database, but it can be build using data base technology. A data platform must also address the problems that come from semantic ambiguity (what is one thing), support the timescales and complexities found in the physical world, and the reality that both the physical world as well as its digital representation change with time. In other words, the data platform must support the nature of scientific work.
Scientific work can be seen as a four step process:
Gather data, including deciding what data is needed
Analyse data, predict outcomes and device alternative courses of action
Perform the most attractive course of action
Monitor effects, gather more data and repeat
This is the approach most professional professions use, it be medical doctors, car mechanics, detectives, geo-scientists, airline pilots, intelligence service officers, etc. Analysis can involve inductive, abductive reasoning dependent of context and problem at hand. Be aware that any reasoning, judgement and classification depends trustworthy data. Without trustworthy data, no trustworthy course of action.
The tale of a rock
The OSDU™ Data Platform support scientific workflows and the best way to describe what that entails is to provide an example, so here we go.
Below a picture of a rock that I found many years ago. At the first glance a fact sheet can be made capturing observable basic facts such as location found, density (weight/volume) and the camera (sensor) used to make the image. Further that it contain quartz (white), olivin (green) and a body that most likely is eclogite (lay man’s work).
Since the stone have several areas of interest and is a 3 dimensional object several images is needed. The easiest way to deal with the images is to place them in a cleverly named file folder and create fact sheet in a database, referencing the image folder and the physical archive location.
Areas of interests are photographed and classified in more detail. Where should the classification be stored? A separate database table could work, but as our needs grow what began as a simple thing become unmanageable as new needs emerge. One physical stone has become multiple independent digital artefacts and we are knee deep attempting to answer “what is one thing?”. Add to the problem that in the real world we do not have a handful of datasets, but thousands. Equinor’s Volve dataset counts 40.000 files.
The OSDU™ Data Platform is made for this kind of problem as can be seen in the next picture. The OSDU™ Data Platform includes a content store (files), a catalogue store (documents) and a search engine (Elastic).
In this case content is stable. The rock does not change, but our understanding of the rock derived from images might change. Lets say that we become interested in the main body of the rock. Then we can go back to the original, make a new sample and add it to the structure. We have derived new insight from existing data and captured it as shown in the diagram below.
The diagram show how a third sample has been added to the story and in addition a interpretation has been derived and linked to the area. The model captures the insights as it emerge. This is the core of the scientific work. It can be argued that the OSDU™ Data Platform is a knowledge capture system.
Knowledge capture
The OSDU™ Data Platform is made to capture subsurface knowledge as illustrated in the diagram below. Seismic is acquired for a geographical area through surveys. The end product from seismic surveys are seismic data files that are interpreted using specialist software tools and one of the findings can be a horizon.
Seismic is measured in the time domain and that implies that the depth of the horizon require correlation with markers from a well log as shown to the left of the diagram. Markers are made when the wellbore is drilled and can be backed by the cuttings that come out of the borehole.
There are two main takeaways from this diagram. Firstly, datasets in terms of log files, rock images and seismic images are contextualised by a domain specific catalogue structure. Secondly, as data is analysed and knowledge is derived in terms of markers and horizons, the insights are managed as data. This is by the way an example of how causal inference works out in practice.
As time goes by and new well bores are made, new seismic surveys conducted both the amount of raw data grows as does the derived knowledge from the data. This takes us to the two most important capabilities provided by the OSDU™ Data Platform, lineage aka provenance and immutability.
Lineage enables provenance, basically that we know what data was used as source for a horizon and marker. Provenance is the key to trustworthy information. As new data emerge, old insights are not deleted but replaced by a new instance that is linked to the previous instance. This mean that the platform can hold multiple copies of the horizon and markers in the diagram above and capture how the understanding of the underground has evolved over time.
The end
The reader should now have a feel with the basic capabilities provided by the OSDU™ Data Platform including some of its scientific fundament. It should also be clear that its more than a data platform. Its really better understood as a knowledge capture system that contextualises data into information that can be reasoned about and used to support decisions while maintaining provenance.
Further the OSDU™ Data Platform resolves som of the hardest parts of earth science and earth modelling as well as being faced with one of computer sciences hardes questions, what is one thing? These are topics that will be revisited.
Hopefully you as reader have enjoyed the journey and I can promise that more stuff will follow. Finally, I hope that the readers see the potential of both technology and approach for other sectors than earth science.