
The OSDU® Data Platform (hereafter called “the data platform”) has evolved a lot since The OSDU® Data Platform – A Primer was written back in January 2023. It has more than enough functionality that can be used, and it is commercially available from your favourite cloud service provider.
The intent with this blogpost is to explore and expand our thinking on the role of a data platform as a key component in a larger digital ecosystem.
Recap of core concepts
The foundation of the data platform is the data classification schema and design philosophy that is illustrated by using entities from the wells domain (figure 1). Master data objects are orange, reference data is turquoise, and work product components are yellow.
Master data entities represents real world things or concepts that have lifecycles. It is possible to think about master data entities as scaffolding’s or coat hangers, i.e., as object that act as the conceptual bearers in a domain. Work product components provide meta data about datasets that are connected to the actual master entities. Example, when a new fluids report is made and ingested into the data platform, a new fluids report work-product-component entity instance is made and connected to the actual wellbore.
Reference data represent concepts that are stable over time such as coordinate reference systems, units of measure, and various codifications such as country codes. Reference data are often defined by standards and might includes transformation services such as going from metric to imperial units and vice versa. The data platform has a rich set of reference data structures defined, the Coordinate Reference System (CRS) being one of them.
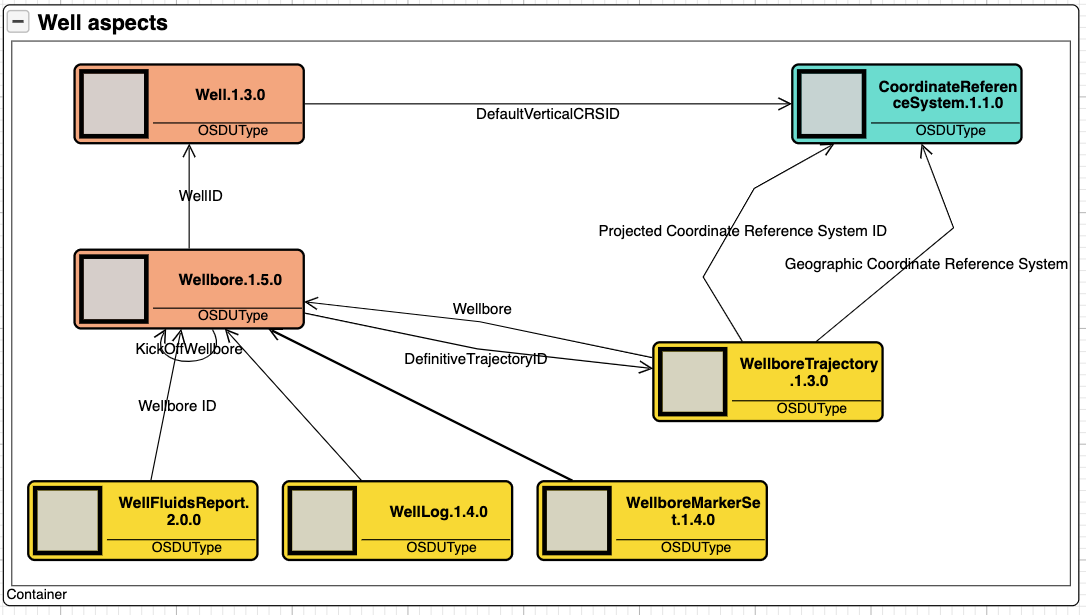
Figure 1 tells the reader that the wells domain has two concepts; well and wellbore. That all wells are geolocated and that the wellbore is the aggregator of associated datasets such fluid reports, logs, markers and trajectories. Lastly that trajectories come with some additional features that we leave as is for now.
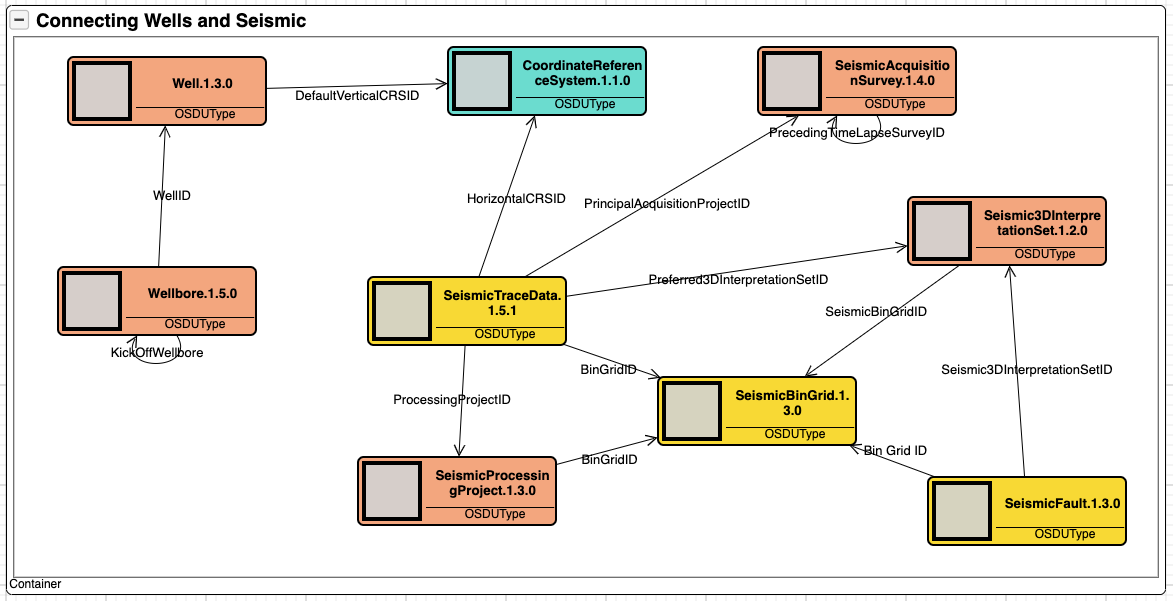
Figure 2 shows how independent domains such as wells and seismic can be related by use of geolocation (CRS). This is extremely useful when we want to know what wells exist in an area covered by a seismic survey.
We can also see how the seismic domain is organised into three fundamental concepts; the acquisition survey; the processing project; and the interpretation set. Further, that the seismic domain consists of three data sets; trace data, bin grids and interpreted faults. What these concepts mean is out of scope as there are much more to both wells and seismic than shown here. Finally, these two figures shows the value of visualisation when exploring the data platform. The tool used is Kava’s AKM Modeller.
The OSDU® data models covers most of the subsurface work. Beginning with seismic acquisition, processing and interpretation. Crossing into structural and dynamic earth modelling, field development planning, well architecting and delivery, including geological and petrophysical evaluation. Further down the road we find production planning and optimisation where the current support is limited.
The subsurface data models are now so good that the mining industry has started to explore them. It should not take much fantasy to see how the data platform can be extended into adjacent domains that manage geolocated hazards and assets. Examples include civil infrastructure such as railroad tracks, roads, water and energy infrastructure, or for that matter, medical records about patients, deceases, and treatments. The key being its easier to repurpose something that works than starting from scratch.
Data work
So far the thinking and discussions about the OSDU® Data Platform has been as a technical product that create value through its existence. In many ways this viewpoint has served us well during development of the technical capabilities, but it might fall short when we want to understand how does it create value for the end user organisations.
The catch of cause is that the data platform does not exist in a vacuum. To create value for its users, they be oil and gas companies or software companies the data platform will be part of a larger functional information system. An information system is much more than its technological components. Literature defines an information system as a formal socio-technical, organisational system designed to collect, process, store and distribute information. From this definition is it obvious that it is a complete different task to develop and implement an information system than developing its technical components.
One way to better understand an information system is by exploring data work, and how such work unfolds in an industrial context. Here will we lend ourself on the work done by the NTNU researchers Parmiggiani et al that is captured in their 2022 article In the Backrooms of Data Science where we can read:
“Much Information Systems research on data science treats data as pre-existing objects and focuses on how these objects are analyzed. Such a view, however, overlooks the work involved in finding and preparing the data in the first place, such that they are available to be analyzed. In this paper we draw on a longitudinal study of data management in the oil and gas industry to shed light on this backroom data work. We find that this type of work is qualitatively different from the front-stage data analytics in the realm of data science, but is also deeply interwoven with it. We show that this work is unstable and bidirectional. That is, the work practices are constantly changing and must simultaneously take into account both what data it might be possible to get hold of as well as the potential future uses of the data. It is also a collaborative endeavour, involving cross-disciplinary expertise, that seeks to establish control over data and is shaped by the epistemological orientation of the oil and gas domain”.
Based on these findings should we begin to think about the OSDU® Data Platform as a component in an information system that support industrial asset lifecycle management and the decision making related to those assets. In such context data work is fundamental for the decision making (figure 3).
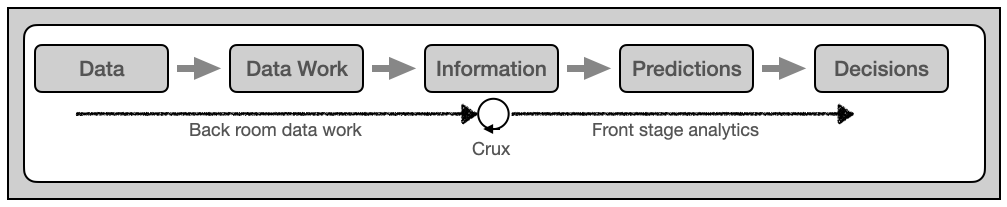
The primary function of back room data work is to turn data into information that is fit for purpose for front stage analytics aka data science aka machine learning and AI (Artificial Intelligence). I have deliberately replaced the word analytics by prediction in figure 3. The reason is professor Ajay Agrawal‘s 2017 statement that the value of AI is reduced prediction cost. Cheaper predictions provides options, and options is what is judged when decisions are made.
Predictions and options are the workhorses of decision making, and subsurface workflows, done by hand or machine is fundamentally about prediction options. We don’t know if a formation contain hydrocarbons before a well has been drilled. And even when it’s drilled the reservoir might be missed by a meter or two. The more an option is backed by quality data the higher probability for success.
This means that the back room data work boils down to implementing the data stewardship that enables the best possible information given the data at hand. It’s directly connected to the prediction making that is based on the information we have, and the underpinning causal relationships that governs the physical world we are part of (liquids flow downwards due to gravity).
In situations we do not have enough information are we left with three options. 1) make the decision on the information we have, and accept the uncertainty. 2) acquire more data if possible. 3) use additional data we have to create a richer foundation. This is where the epistemological nature of data work materialise. What additional information can we include and what does that additional information bring to the table with respect to the probability for our hypothesis beeing correct or wrong? This takes us directly to Bayes rule and causal inference, concepts that sits at the core of AI.
The data work challenge can therefore be wrapped up as a need for good data stewardship, and data stewardship requires tools and practice. The OSDU® Data Platform is a tool that enables creation of an information system that simplifies data stewardship, an information system that systematically transform the organisation data into a high value trusted information assets for its users.
