Object-Oriented Enterprise Architecting

Object-Orientation

Object-orientation a.k.a object-oriented thinking / modelling / programming is a way to explore real world complexity by turning real world elements into interacting “objects”. A restaurant, as an example can be modelled as a set of interacting objects representing concepts such as guests, tables, waiters, cooks, orders, bills, dishes, payments and so on. Object-oriented modelling can be conducted by rudimentary tools as as illustrated in figure 1.

Figure 1: Object Model

Object-orientation goes back to the late 1950ties, but was first made available for broader usage with the Simula programming language in the mid 1960ties. Simula inspired new object oriented languages such as Smaltalk, C++, Java and many more.

Object-oriented programming lead to the development of object-oriented analysis and design, and more formal and powerful modelling techniques and languages such as UML (Unified Modelling Language), SYSML, ArchiMate and AKM (Active Knowledge Modelling) to mention a few. It can also be argued that EventStorming, a collaborative workshop technique is object oriented.

On the dark side, object-orientation does not protect agains poor practice. Poor design practice leads typically to tightly coupled systems, systems that become expensive or even impossible to adapt and enhance as technology and business change.

Design Patterns

Design patterns is one way to enhance design practice by provision of tangible abstractions and concepts that help practitioners to create more healthy structures. Patterns originate from civil architecture and is attributed to Christopher Alexander and his work on pattern languages for buildings and cities.

The Gang of Four (GoF) 1995 book Design Patterns – Elements of Reusable Object-Oriented Software was the first book that introduced patterns for object-oriented software development. The book is still relevant and highly recommended as an introduction to patterns.

Another seminal book that embrace patterns is Eric Evans 2003 book Domain-Driven Design: Tackling Complexity in the Heart of Software. Eric argues that business problems are inherently complex, ambiguous and often wicked, and therefor must the development team spend more time on exploring domain concepts, and to express and test them in running code as fast as possible to learn.

Eric argues also for the importance of a common language in the team, the ubiquitous language, a language that embraces both domain and technical concepts. OrderRepository is an example of such language that make equally sense for subject matter experts and developers alike. It enables conversations like: orders are stored in the order repository and the order repository provides a function for creating and finding orders.

EventStorming is framed around the discovery and capture of three design patterns: Commands, DomainEvents and Aggregates as illustrated by figure 2.

Figure 2: Event Storming Artefacts

The model reads that the doctor diagnoses the patient and add the diagnosis to the patient record. Then a treatment is prescribed, before the effects are checked at a later stage. EventStorming begins with capturing the capturing the events, and from them the commands and aggregates are derived.

There are particularly three software design patterns that I think should be part of every enterprise architects toolbox.

  • Command Query Responsibility Segregation (CQRS) separates read operations from write operations enabling a clearer thinking on what those things mean in our architecture. Data Mesh is not possible without CQRS.
  • Data Mesh is an architectural approach to manage operational and analytical data as products. Its enabled by CQRS and it comes with its own suppleness.
  • Event Sourcing is based on storing changes as independent events. Bank accounts works this way as each deposit and withdrawal are stored as a a sequence of events, enabling the account to answer what was my deposits on a particular date back in time. Event Sourcing should not be conflated with Event Storming which is a workshop methodology.

The motivation behind the claim is that these patterns shape the architecture and the architects thinking. By knowing them the architect can make rational judgments with respect to their relevance in a given context.

Enterprise Architecting

Enterprise architects have used object-oriented concepts for years taking advantage of modelling languages such as UML, ArchiMate and others. Architects with interest and understanding of agile methodologies might also have explored EventStorming workshop techniques.

Independent of technical tooling enterprise architects face a growing challenge as enterprises digitalise their operating and business models. Take our healthcare model and scale it to a hospital or include multiple hospitals, the primary health services and elder care. In such environment you will have solutions from multiple vendors, solutions from different technical generations, and solutions that are outside your own control. Add then that sector is political sensitive and full of conflicting interests.

The catch being that this is not unique for healthcare but is the nature of the real world. Real world business problems are most often wicked or complex. Scaling up forces architects to slice the problem space into useful modules that can be managed independently. Such slicing must be done with care as coupling and lack of cohesion will haunt the chosen architecture.

The architectural crux is to get the slicing right. Sometimes this is easy as system boundaries follows natural boundaries in the domain. But this is not always the case as many enterprises have ended up with dysfunctional structures that leads to fragile and error prone handovers. Handover of patient information in the healthcare sector is a good example. The catch is that handovers are everywhere and its effects are loss of critical information and rework.

Strategic Design

Domain Driven Design offers a technique that help us model the slicing of a large model called Bounded Context and Context Mapping. Applied on our healthcare example we can create something like the diagram in figure 3.

Figure 3: Context map

Bounded Context are organised into a Context Map that captures the relationships between various bounded context. Adding to the complexity, each bounded context might need access to different aspects of the patient record. Example, pharmacies have no need for individual food constraints that are relevant for nursing homes and hospitals.

Making this even complex is the fact that all these contexts can be further decomposed as in figure 4. Add to this that in the case of an individual patient, specialists from different contexts need to collaborate to decide upon the path forward. It’s normal for surgeons, radiologists and oncologists to discuss a x-ray image of a tumor. Such trans-discipline collaboration is critical for problem solving, and its in these interactions balanced solutions to hard problems are shaped.

Figure 4: Domain decomposition

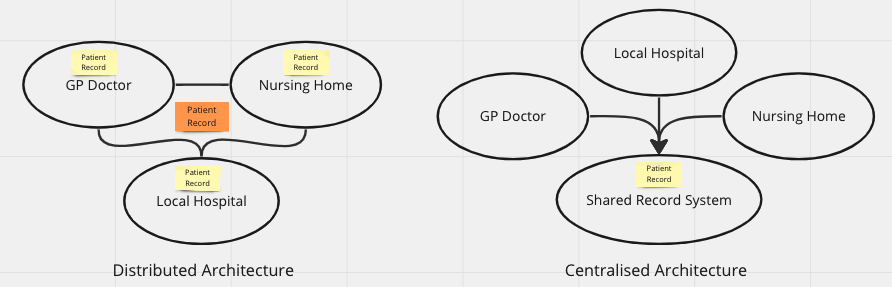
Figure 5 present two architectural alternatives, distributed and centralised. In the distributed architecture each bounded contexts is free to have whatever system they find useful as long as they are able to send and receive patient record update messages (events).

In the centralised architecture a new shared bounded context that manages the patient record has been introduced and the “operational” contexts accesses the shared and centralised record management system. Which one of those alternatives are “best” boils down to tradeoffs. Both come with strengths and weaknesses.

Figure 5: Architectural Styles

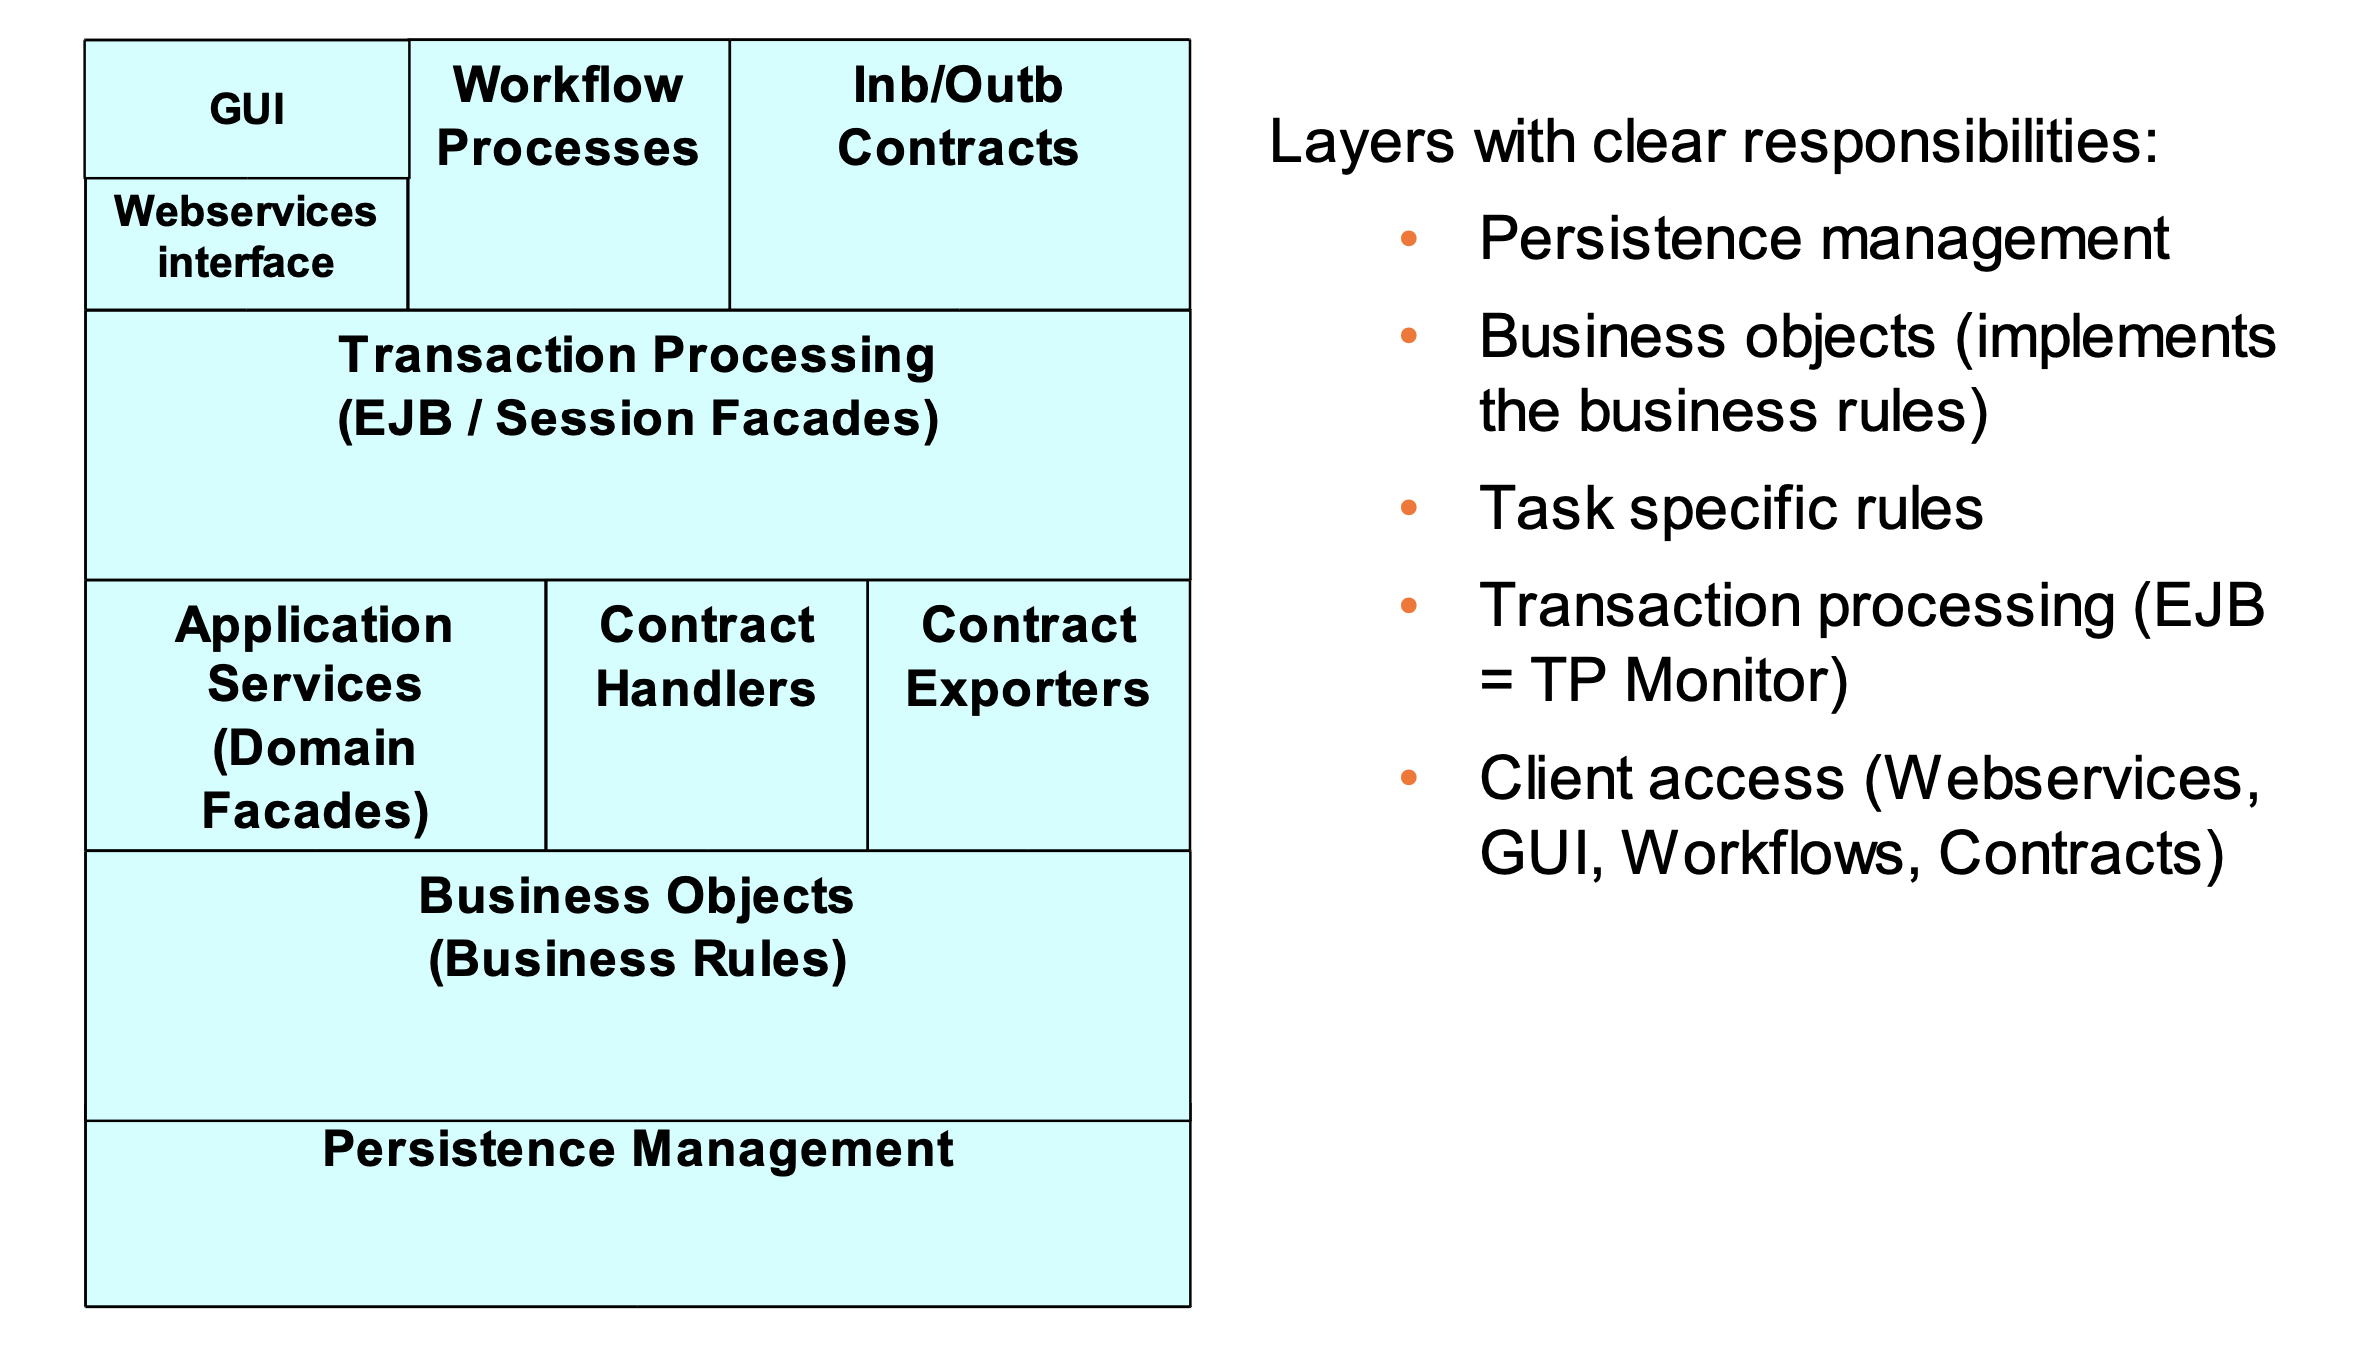
What matters is how we choose to pursue implementation. The crux i distributed architectures boils down to message standardisation and the establishment of a transport mechanisms. Centralised architecture can be realised in two principle ways.

  • By using an old school integrated application with user interfaces and a shared database. Then force everybody to use the same solution. Integrated means tight coupling of user interfaces and the underpinning data / domain model into something that is deployed as one chunk.
  • By developing a loosely coupled application or platform based on API’s that can be adapted to changing needs. Loos coupling means that the data management part – the record keeping is separated from end user tools along the lines described here.

Making the wrong choice here is most likely catastrophic, but beaware that all alternatives comes with strengths and weaknesses. To understand the alternatives feasibility a bottom-up tactical architecting endeavour is needed. Such endeavour should take advantage of battle proven patterns and design heuristics. In the end a claims based SWOT (Strengths, Weaknesses, Opportunities and Threats) analysis might prove its weight in gold.

Tactical Design

Tactical design implies to dig into what users do, what information they need for doing what they do and to develop the information backbone that shapes the sector’s body of knowledge. Evaluation of implementation alternatives require tactical level design models as the devil is in the details.

Tactical design is best explained using a practical example taking advantage of the capabilities provided by the AKM (Active Knowledge Management ) modelling approach. What make AKM different from other methods and tools is its dynamic meta models. The example model in figure 6 exploits the IRTV (Information, Roles, Tasks and Views) meta model. A deep dive in AKM modelling and meta-modelling will be addressed later.

The example builds on our healthcare case, and the purpose is to highlight the main modelling constructs, their usage and their contribution to the model as a tool for enlightened discussions, and future tradeoff analysis.

Healthcare can be thought of as stories about patients, diseases and treatments and that is what we will try to demonstrate by our toy model. Take note of the fact that some Information datatypes and Views have suggested types that can be used to create a richer and more domain specific language.

Be aware that diseases might have multiple treatments, and that a treatment can be applicable for more than one disease. This is by the way a good example of the “muddiness” of the real world where everything one way or the other is entangled.

Figure 6: AKM Enterprise Architecture Model

The model in figure 6 captures two stories. The first story present a patient consultation session where the GP diagnoses a patient and updates the patient’s medical record. The second story shows how a researcher updates the treatment protocol.

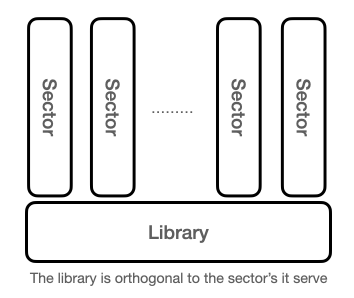
At this point the sharp-eyed should be able to discover a pattern, and for those who don’t please read Reinventing the Library before you start studying figure 7 below. Here the model from figure 6 is restructured and simplified so the key points can be highlighted.

Figure 7: Simplified Enterprise Architecture with Bounded Contexts

Firstly, the sector’s body of knowledge is structured around three concepts that are managed in a “library”. Such library could of cause be extended to include infrastructure components such as hospitals, caring homes, and even staffing. It all depends on what questions the enterprise want to answer and accumulate knowledge about.

Secondly, the design of functional domains by grouping related tasks into what DDD defines as bounded contexts. This design task should be guided by the key design heuristic; maximise cohesion, minimise coupling while reflecting over what can be turned into independent deployable’s if the architecture should take physical form as software applications.

Lastly, views as the key to loose coupling and as artefacts that need to be rigorously designed. Views are the providers of what AKM call workspaces. The model above contain two types of views. The first type is used to separate roles from tasks within a bounded context. This view is typically visual and interactive in nature as its designed to support humans. For those familiar with multi-agent design such view could be seen as an agents environment as explained here.

The second type of view are those that bridges between cohesive functional domains and the underpinning library. These views can also be used to create interaction between operational bounded contexts as can be seen in the case of the Diseases View in figure 7.

View would benefit from being designed according to the CQRS pattern, basically separating commands from Queries as shown in figure 8. In addition to queries and commands can views be the home for transformation, event processing and communication. In a software context views exposes domain specific API’s, they represents bounded contexts and they can be deployed independently as architectural quanta’s. Again the sharp-eyed should see that views might be the key for those who want to think in terms of data mesh and data products. A data-mesh boils down to transforming data so the data can be served to fit the consumers needs.

Figure 8: View Architecture

For those of you who are still here a couple of words about knowledge and the theoretical framework that motivated this post – constructor theory.

Constructor theory

Constructor theory or the science of can and can’t is a rather new theory in theoretical physics developed by David Deutch and later Chiara Marletto at the University of Oxford. The essence of constructor theory is that physical laws can be extended to cover what transformations are possible or not. This implies that Physics can be used to define concepts such as information and knowledge.

A constructor is a “machine” that can perform transformations in a repetitive way and to do that transformation it needs a “recipe”. A factory that create airplanes or cars are examples of constructors. Its the institutionalised knowledge in those entities that make it possible to mass produce samples over time with quality.

If we now revisit figure 7 and 8 it should be obvious that what we have architected could be understood as constructors. An that should not come as a surprise since constructor theory defines information by using two counterfactuals; the possibility of copying and of flipping (change state). Knowledge is defined as self preserving information.

My advice to enterprise architects is to read The science of can and can’t – enjoy as it is the perfect vacation companion.

Reinventing the library

Humans have collected, classified, copied, translated, and shared information about transactions and environment since we saw the first light of day. We even invented a function to perform this important task, the library, with the library of Alexandria as one of the most prominent examples from ancient time.

The implementation of the library has changed as a function of technological development while maintaining a stable architecture. The library is orthogonal to the society or enterprise it serve as illustrated in the figure below.

The architectural stability can most likely be explained by the laws of physics. David Deutsch published in 2012 what is now called constructor theory that use contrafactual’s to define what transformations are possible and not. According to the constructor theory of information can a physical system carry information if the system can be set to any of at least two states (flip operation) and that each state can be copied.

This is exactly what the ancient libraries did. The library’s state change when new information arrived allowing the information to be copied and shared. The library works equally well for clay tablets, parchments, papyrus rolls, paper, and computer storage. The only thing that change as function of technology is how fast a given transformation can be performed.

With the introduction of computers the role of the library function changed as many functions migrated into what we can call sector specific applications and databases. In many ways we used computers to optimise sectors at the cost of supporting cross sector interoperability. I think there was a strong belief that technology would make the library redundant.

The effect being that cross sector interaction become difficult. The situation has in reality worsened as each sector has fragmented into specialised applications and databases. What was once an enterprise with five lines of business (sectors) might now be 200 specialised applications with very limited interoperability. This is what we can call reductionism on steroids as illustrated in the figure below.

The only companies who have benefitted from this development are those who provide application integration technology and services. The fragmentation was countered by what I like to call the integrated mastodonts that grew out from what once was a simple database that has been extended to cover new needs. Those might deserve their own blogpost and we leave them for now.

Data platforms

In the mid 1990ties the Internet business boom began. Amzon.com changed retail and Google changed search as two examples. A decade later AWS provided data center services on demand, Facebook and social media was born, and in 2007 Apple launched the iPhone, changing computing and telephony forever.

Another decade down the road, around 2015, the digitalisation wave reached the heavy-industry enterprise space. One of the early insights was the importance of data and the value of making data available outside existing application silos. Silos that had haunted the enterprise IT landscape for decades. By taking advantage of the Internet technology serving big data and social media application the industrial data platform was born.

The data platform made it easier to create new applications by liberating data traditionally stored in existing application silos as illustrated below. The sharp minded should now see that what really took place was reinventing the library as a first order citizen in the digital cityscape.

The OSDU™ Data Platform initiative was born on the basis of this development where one key driver was the understanding that a data platform for an industry must be standardised and its development require industry wide collaboration.

Data platform generations

We tend to look at technology evolution as a linear process, but that is seldom the case. Most often the result of evolution can be seen as technological generations, where new generations come into being while the older generations still are in existence. This is also the case when it comes to data platforms.

Applied on data platforms the following story can be told:

  • First generation data plattforms followed the data lake pattern. Here application data was denormalised and stored in an immutable data lake enabling mining and big data operations.
  • Second generation data plattforms follows the data mesh pattern taking advantage of managing data as products by adding governance.
  • Third generation data platforms take advantage of both data lake and data mesh mechanisms but what make them different is their support of master data enabled product lifecycle management.

Master data is defined by the DAMA Data Management Body of Knowledge as the entities that provide context for business transactions. The most known examples includes customers, products and the various elements that defines a business or domain.

Product lifecycle management models

Master data lifecycle management implies capturing how master data entities evolve with time as the their counterparts in the real world change. To do so a product model is required. The difference between a master data catalogue and a product model is subtle but essential.

A master data catalogue contextualise data with the help of metadata. A product model can also do that, but in addition it captures the critical relationships in the product structure as a whole and tracks how the product structure evolve with time. Using the upstream oil and gas model below the following tale can be told.

When a target (pocket with hydrocarbons) shall be realised a new wellbore must be made. When there are no constraints there can be thousand possible realisations. As the number of constraints are tightened the number of options are reduced and in the end the team land on one that is preferred, while keeping the best options in stock in case something unforeseen happens. Let’s say that the selected well slot breaks and can’t be used before it is repaired, a task that take 6 months. Then its possible for the team to go back to the product model and look for alternatives.

Another product model property is that we can go back in time and look at how the world looked like at a given day. In the early days of a field its possible to see that there was an area where we had seismic that looked so promising that exploration wells was drilled, leading to the reservoir that was developed and so on. The product model is a time machine.

Our example product model above is based on master data entities from upstream oil and gas, entities that are partly addressed by the OSDU™ Data Platform. There are two reasons for using the OSDU™ Data Platform as an example.

Firstly, I work with its development and have reasonably good understanding of the upstream oil and gas industry. Secondly, the OSDU™ Data Platform is the closest I have seen that can evolve into a product lifecycle centric system. The required changes are more about how we think as we have the Lego bricks in place.

Think of the OSDU™ Data Platform as a library of evolutionary managed product models, not as only a data catalogue. Adapt the DDMS (Domain Data Management Services) to become work spaces that operates on selected aspects of the product models, not only the data. The resulting architecture is illustrated below.

Moving to other sectors the same approach is applicable. A product model could could be organised around patients, deceases and treatments or retail stores and assortments for that matter. The crux is to make the defining masters of your industry the backbone of the evolutionary product model.

This story will be continued in a follow-up where the more subtle aspects will be explored. One thing that stand out is that this make it easier to apply Domain Driven Design patterns as the library is a living model, not only static data items.

Hopefully if you have reached to this sentence, you have some new ideas to pursue.

The OSDU™ Data Platform – A Primer

Prelude

The OSDU™ Data Platform is the most transformative and disruptive digital initiatives in the energy industry. Never before have competitors, suppliers and customers joined forces to solve a common set of problems taking advantage of open-source software licensing, agile methods and global collaboration.

Originally OSDU was an acronym for Open Subsurface Data Universe, directly derived from Shell’s SDU (Subsurface Data Universe) contribution. There is great video presenting Shell’s story that can be found here. The OSDU™ Forum decided to remove the binding to the subsurface and to register OSDU as trademark owned by The Open Group paving the way for adaptation beyond subsurface, enabling constructs like:

  • OSDU™ Forum – the legal framework that govern community work
  • OSDU™ Data Platform – the product created by the forum

The OSDU™ Forum’s mission is to delivers an open-source, standards-based, technology-agnostic data platform for the energy industry that:

  • stimulates innovation, ​
  • industrialises data management, and ​
  • reduces time to market for new solutions​

The mission is rooted in clearly stated problems related to digitalisation of energy and the journey till today is summarised below:

2016 – 2017

  • Increased focus on digitalisation, data and new value from data in the oil and gas industry
  • Oil and gas as companies make digital part of their technology strategies and technical roadmaps

2018-2019: 

  • Shell invites a handful oil and gas companies to join forces to drive the development of an open source, standardised data platform for upstream O&G​ (the part the find and extract oil and gas from the ground)
  • The OSDU™ Forum was formally founded in September 2018 as an Open Group Forum​ based on Shell’s SDU donation as the technical starting point
  • Independent software companies, tech companies and cloud service providers join. Bringing the cloud service providers onboard was a strategic aim. Without their help commercialisation would become more difficult
  • July 2019: SLB donates DELFI data services​, providing additional boost to the forum.

2020-2021:​

  • Release of the first commercial version – Mercury from a merged code base is made available by the cloud service providers for consumption

2022 and beyond

  • Operational deployments in O&G companies.
  • Hardening of operational pipelines and commercial service offerings (backup, bug-fixing) ​
  • Continuous development and contribution of new OSDU™ Data Platform capabilities.

The OSDU™ Data Platform was born in the oil and gas industry and it is impossible to explain the drivers without a basic understanding of the industrial challenges that made it, challenges that come from earth science and earth science data.

Earth science

Earth science is the study of planet Earth’s lithosphere (geosphere), biosphere, hydrosphere, atmosphere and their relationships. Earth science forms the core of energy, it be oil and gas, renewables (solar, wind and hydro) and nuclear. Earth science inherently complex because it’s trans-disciplinal, deals with non-linear relationships, contain known unknowns, even unknowable’s, and comes with a huge portion of uncertainty.

Hydrocarbons forms in the upper part of earth’s lithosphere. Dead organic material is transported by rivers to lakes where it sink and is turned into sediments. Under the right conditions the sediments become recoverable hydrocarbons by processes that takes millions of years. In the quest for hydrocarbons geo-scientists develop models of earths interior that help them to predict where to find recoverable hydrocarbon.

Earth models

Earth models sits at the core of the oil and gas industries subsurface workflows and are used to find new resources, develop reservoir drainage strategies, investment plans, optimise production and placement of new wells. Earth models are used to answer questions like:

  • How large hydrocarbon volumes exists?
  • How is the volume placed in the reservoir?
  • How much is recoverable in the shortest possible time?
  • As reservoirs empties, where are the remaining pockets?
  • How much has been produced, from when, and how much remains?
  • How to drain the volumes as cost efficient as possible?

Earth models are developed from seismic, observations (cores, well logs and cuttings) and produced volumes. When exploring new areas access to relevant datasets is an issue. Exploration wells are expensive and finding the best placement is important. Near-field exploration is easier as the geology is better known. Some production fields use passive seismic monitoring allowing continuous monitoring of how the reservoir changes while being drained. Another approach is 4D seismic, where new and old seismic images are compared.

Seismic interpretation means to identify geological features such as horizons and faults and to place them at the appropriate place in a cube model of the earth. How this is done is shown in this 10 minute introduction video.

The pictures to the left shows a seismic image. To derive useful information requires special training as it is a process of assumptions and human judgement. To the right a picture of log curves and for more information about well logging please read this. Seismic datasets are very large and relatively expensive to compute. Well logs are smaller in size, but they come in huge numbers and choosing the best one for a specific task might be a time consuming process.

Timescales

Oil and gas fields are long-lived and the longevity represents a challenge on its own that is best illustrated using an example. The Norwegian Ekofisk field, discovered in 1969, put on stream in 1971, and expected to produce for another 40 years. The catch being that data acquired with what is regarded state of art technology will outlive the technology. Well logs from the mid sixties, most likely stored on paper are still relevant.

Adding to the problem is the changes in measuring method and tool accuracy. This is seen when it comes to metrological data. Temperature measured with a mercury gauge come with an accuracy of half degree celcius. Compare that with the observed temperature rise of one degree over the last hundred years. Being able to compare apples with apples become critical and therefore is additional sources of data required.

When the storage technology was paper this was one thing, now when we storage has become digital its something else. For the data to be useful a continuous reprocessing and re-packeting is required.

Causal inference

Subsurface work, as other scientific work is based on causal inference i.e., asking and answering questions attempting to figuring out the causal relationships in play.

The Book of Why defines three causation levels seeing, doing and imagination as illustrated by the figure below.

Source: The Book of Why

Seeing implies observing and looking for patterns. This is what an owl do when it hunts a mice, and it is what the computer does when playing the game of Go. The question asked is; what if I see… eluding to that if something is seen it might impact the probability for something else to be true. Seismic interpretation begins here with asking where are the faults while looking at the image.

Doing implies adding change to the world. It begins by asking what will happen if we do this? Intervention ranges higher than association because it involves not just seeing but changing what is. Seeing smoke tells a different story than making smoke. Its not possible to answer questions about interventions with passively collected data, no matter how big the data set or how deep the neural network. One approach to do this is to perform an experiment, observing the responses. Another approach is to build a causal model that captures causal relationships in play. When we drill a new well that can be seen as an experiment where we both gather rung one data, and also discover rung 2 evidence related to what work and what does not work. The occurrence of cavings and a potential hole collapse being one example.

A sufficient strong and accurate causal model can allow us to use rung one (observation) data to answer rung two questions. Mathematically this can be expressed as P(cake | do (coffee)) or in plain text, what will happen to our sales of cake if we change the price of coffee.

Imagination implies asking questions like my headache is gone, but why? Was it the aspirin I took? The food I ate? These kind of questions takes us to counterfactuals, because to answer them we must go back in time, change the history and ask, what would have happened if I had not taken the aspirin? Counterfactuals have a particularly problematic relationship with data because data is by definition facts. Having a causal model that can answer counterfactual questions are immense. Finding out why a blunder occurred allow us to take the right corrective measures in the future. Counterfactuals is how we learn. It should be mentioned that laws of physics can be interpreted as counterfactual assertions such as “had the weight on the spring doubled, its length would have doubled” (Hooke’s law). This statement is backed by a wealth of experimental (rung 2) evidence.

By introducing causation the value of useful data should be clear. Without trustworthy data, that we are not able to agree about what we can see, there cant be any trustworthy predictions, causal reasoning, reflection and action. The value of a data platform is that it helps with the data housekeeping at all levels. Input and output from all the three rungs can be managed as data.

Causal models are made from boxes and arrows as illustrated in the figure below. How the factors contributes can be calculated as probabilities along the arrows. The beauty of causal models is that their structure is stable, while the individual factors contribution will change. Loss mean that mud leaks into the formation due to overpressure, and gain implies that formation fluids leaks into the wellbore. Both situations are undesired as they might lead to sever situations during drilling.

Finally, dynamic earth modells based on fluid dynamics captures causal relationships related to how fluids flow in rock due to the laws of physics.

Digitalisation

Until less than 60 years ago earth models as most other models was paper based. With the development of computers earth models have become digital with raw data and derived knowledge carved into software and databases.

Despite digital tooling earth science work practice has not changed much. Scientists collects data, build models and hypothesis, analyse and predict possible outcomes.

One thing that has changed is the amount of data. The dataset shared by Equinor for the retired Volve field consists of 40.000 files. Volve was a small field producing for a decade. To know what dataset can / should / could be used for what type of work is not trivial.

Another challenge is that each discipline has its own specialist tools emphasising different aspects of the dataset. This mean that two disciplines will struggle to synthesise their results at the end. Adding to the challenge the fact that models are tied to the tool and the individual users preferences and understanding.

The result is an individ centred, discipline specific tooling that make a holistic (trans disciplinary) view difficult if at all possible. Said in other words: we have tools the forest, tools for the threes and tools for the leaves, but no tool that allow us to study threes in context of the forest or leaves in context of a three. Philosophically speaking is this the result of applying reductionism on a complex problem.

The effect is fragmentation and inconsistency across individuals, tools, disciplines and organisational units leading to loss of knowledge, loss of trust and continuously rework as people struggle to build on each others work.

Fragmentation is a good starting point for the next topic that create a lot of pain when building digital data models, the question of what is one thing and when does a thing change so much it become a new thing.

One thing

According to William Kent in Data and Reality answering what is one thing forces us to explore three key concepts:

  • Oneness. What is one thing?
  • Sameness. When we say two things are the same, or the same thing? How does change affect identity?
  • Categories. What is it? In what categories do we perceive the thing to be? What categories fo we acknowledge? How well defined are they?

Oneness underlies the general ambiguity of words and we will use an example from the book regarding the word “well” as used in the files of an oil company.

In their geological database, a “well” is a single hole drilled in the surface of the earth, whether or not it produces oil. In the production database, a “well” is one or more holes covered by one piece of equipment, which has tapped into a pool of oil. The oil company had trouble integrating these databases to support a new application: the correlation of well productivity with geological characteristics.

This imply that the word well is ambiguous across contexts. Observe that the ambiguity lays with the understanding of the concept well. The production database might have used the term well for what a geologist might think of as a wellbore.

What we observe here is ambiguity across contexts. The production database might have used the term well for what a geo-scientist might think of as a wellbore. Reading along we find this:

As analyst and modellers, we face “oneness”, “sameness” and “categories”. Oneness means coming up with a clear and complete explanation of what we are referring to. Sameness means reconciling conflicting views of the same term, including whether changes (and what type of changes ) transform the term into a new term. Categories means assigning the right name to this term and determining whether it is an entity type, relationship, or attribute on a data model. Oneness, Sameness and Categories are tightly intertwined with one another.

The main takeaway from this is that the ambiguities that we find in a trans-disciplinary fields such as earth science will create problems if not properly addressed. These ambiguities has more to do with how disciplines thinks and express themselves than finding a digital representation. The challenge sits with the semantics of language.

The value of standardising terminology is seen in medicine and anatomy where every piece of the human body is given a latin name that is thought and used across disciplines.

Contextualisation

Domain Driven Design provide two architectural patterns; Bounded Context and Context Mapping that help software architects and data modellers to create explicit context and context relationships. Bounded contexts and context maps allows architects to practice divide and conquer without loosing the whole. Reconciling might prove to be much harder than first thought. The picture below shows practical use of how bounded contexts can be applied on the well problem described above.

By modelling the two applications as bounded context it become clear that reconciliation will require use of a new context as forcing one applications definition on the other will not work. Therefore is it better to create a new bounded context that reconcile the differences by introducing new terminology.

The role of a data platform

A data platforms store, manage and serve data to consumers while adhering to the governance rules defined for the data. A data platform is not a database, but it can be build using data base technology. A data platform must also address the problems that come from semantic ambiguity (what is one thing), support the timescales and complexities found in the physical world, and the reality that both the physical world as well as its digital representation change with time. In other words, the data platform must support the nature of scientific work.

Scientific work can be seen as a four step process:

  1. Gather data, including deciding what data is needed
  2. Analyse data, predict outcomes and device alternative courses of action
  3. Perform the most attractive course of action
  4. Monitor effects, gather more data and repeat

This is the approach most professional professions use, it be medical doctors, car mechanics, detectives, geo-scientists, airline pilots, intelligence service officers, etc. Analysis can involve inductive, abductive reasoning dependent of context and problem at hand. Be aware that any reasoning, judgement and classification depends trustworthy data. Without trustworthy data, no trustworthy course of action.

The tale of a rock

The OSDU™ Data Platform support scientific workflows and the best way to describe what that entails is to provide an example, so here we go.

Below a picture of a rock that I found many years ago. At the first glance a fact sheet can be made capturing observable basic facts such as location found, density (weight/volume) and the camera (sensor) used to make the image. Further that it contain quartz (white), olivin (green) and a body that most likely is eclogite (lay man’s work).

Since the stone have several areas of interest and is a 3 dimensional object several images is needed. The easiest way to deal with the images is to place them in a cleverly named file folder and create fact sheet in a database, referencing the image folder and the physical archive location.

Areas of interests are photographed and classified in more detail. Where should the classification be stored? A separate database table could work, but as our needs grow what began as a simple thing become unmanageable as new needs emerge. One physical stone has become multiple independent digital artefacts and we are knee deep attempting to answer “what is one thing?”. Add to the problem that in the real world we do not have a handful of datasets, but thousands. Equinor’s Volve dataset counts 40.000 files.

The OSDU™ Data Platform is made for this kind of problem as can be seen in the next picture. The OSDU™ Data Platform includes a content store (files), a catalogue store (documents) and a search engine (Elastic).

In this case content is stable. The rock does not change, but our understanding of the rock derived from images might change. Lets say that we become interested in the main body of the rock. Then we can go back to the original, make a new sample and add it to the structure. We have derived new insight from existing data and captured it as shown in the diagram below.

The diagram show how a third sample has been added to the story and in addition a interpretation has been derived and linked to the area. The model captures the insights as it emerge. This is the core of the scientific work. It can be argued that the OSDU™ Data Platform is a knowledge capture system.

Knowledge capture

The OSDU™ Data Platform is made to capture subsurface knowledge as illustrated in the diagram below. Seismic is acquired for a geographical area through surveys. The end product from seismic surveys are seismic data files that are interpreted using specialist software tools and one of the findings can be a horizon.

Seismic is measured in the time domain and that implies that the depth of the horizon require correlation with markers from a well log as shown to the left of the diagram. Markers are made when the wellbore is drilled and can be backed by the cuttings that come out of the borehole.

There are two main takeaways from this diagram. Firstly, datasets in terms of log files, rock images and seismic images are contextualised by a domain specific catalogue structure. Secondly, as data is analysed and knowledge is derived in terms of markers and horizons, the insights are managed as data. This is by the way an example of how causal inference works out in practice.

As time goes by and new well bores are made, new seismic surveys conducted both the amount of raw data grows as does the derived knowledge from the data. This takes us to the two most important capabilities provided by the OSDU™ Data Platform, lineage aka provenance and immutability.

Lineage enables provenance, basically that we know what data was used as source for a horizon and marker. Provenance is the key to trustworthy information. As new data emerge, old insights are not deleted but replaced by a new instance that is linked to the previous instance. This mean that the platform can hold multiple copies of the horizon and markers in the diagram above and capture how the understanding of the underground has evolved over time.

The end

The reader should now have a feel with the basic capabilities provided by the OSDU™ Data Platform including some of its scientific fundament. It should also be clear that its more than a data platform. Its really better understood as a knowledge capture system that contextualises data into information that can be reasoned about and used to support decisions while maintaining provenance.

Further the OSDU™ Data Platform resolves som of the hardest parts of earth science and earth modelling as well as being faced with one of computer sciences hardes questions, what is one thing? These are topics that will be revisited.

Hopefully you as reader have enjoyed the journey and I can promise that more stuff will follow. Finally, I hope that the readers see the potential of both technology and approach for other sectors than earth science.

Toward data-less (micro) services

Data gravity and the laws of scale

The motivation for data-less (micro) services is found in data gravity, the laws of scale and a doze of thermodynamics. All of them a mouthful in their own way, so lets begin.

Data gravity describes how data attracts data in the same way as celestial bodies attracts each other. The more data there is, the stronger the pull. Data gravity has the power to tranform the best architected software systems into unmanageable balls of mud (data & code). What is less understood is data gravity’s underpinning cause that, my claim, can be traced to the universal laws of scale as outlined by professor Geoffrey West in his book Scale, the universal laws of life and death in organisms, cities and companies. For those who do not have the time to read the book, watch one of his many online talks.

In biology each doubling of size leads to an 75% efficiency gain. The effect being that an elephant burn fewer calories pr. kg than a human, who in turn burn less than a mouse as illustrated below.

Metabolic rate as a function of body mass (plotted logarithmically)
Source: Scale

Cities follow the same pattern, but with the factor of 85%. Basically does a big city have fewer gas stations pr inhabitant than a small one. Another aspect is the super-linear scaling of innovation, wages, crime etc that comes from the social networks. This grows with a factor of 15% pr doubling in size.

According to professor West the scaling effects are caused by the fractal nature of the infrastructure that provides energy and removes waste. Think about the human circulatory system and the water, sewage, and gas pipes in cities. I am convinced the same laws apply for software system development, though with different and yet unknown factors.

Last but not least, software development as any activity that uses energy to create order will cause disorder somewhere else. This is due the the second law of thermodynamics. This mean that we need to carefully decide where we want order and how we can direct disorder to places where harm can be minimised.

Data less services:

Data-less services is the natural result of acknowledging the wisdom of the old saying that data ages like wine, software like fish. The essence being that software, the code, the logic, and the technology deteriorate with time, while data can be curated into something more valuable with time.

Therefore it make sense to keep code and data separated. Basically, to separate fast moving code from the slow moving data as a general design strategy. Another way of viewing this is to regard data the infrastructure that scale sub-linear, while the code follows the super-linear growth of innovation.

At first glance this might look like a contradiction in context of the micro-service architectural style that advocates small independent autonomous services. But when we acknowledge that one of the problems with micro-services is sacrificed data management it might make sense.

It is also worth mentioning that separation of code from data is at the heart of the rational agent model of artificial intelligence as outlined in Russel & Norvig’s seminal book Artificial Intelligence: A modern approach where an agent can be anything that can perceive and act upon its environment using sensors and actuators.

A human agent have eyes, ears and other organs for sensing, and hands, legs and voice as actuators. A robotic agent uses a camera, radar or lidar for sensing and actuates tools using motors. A software agent receives files, network packages, keyboard inputs as its sensory inputs and acts upon its environment by creating files, displaying information, sending information to other agents and so on.

The environment could be anything, from the universe to the stock market in Sidney, or a patients prostata that undergo surgery. It can be a physical reality or a digital representation of the same. The figure below shows agent and its environment. An agent consists of logic and rules and the environment consists of data.

Agent and Environment

The internal function of the agent is known as its perception-action cycle. This can be dumb as in a thermostat or highly sophisticated as in a self driving car. While agent research is about the implementation of the perception-action cycle we chose to look at the environment and the tasks the agent need to perform to produce its intended outcomes in that environment.

If the agent is a bank clerk and the environment a customer account, the agent need to be able to make deposits, withdrawals and account statements showing the balance. The environment need to contain the customer and the account. Since the protocol between agent and environment is standardised by an API, agent instances can be replaced by something that is more sophisticated that can take advantage of a richer environment. The customer account represents a long lived asset for the bank and it can be extended to cover loans as well as funds.

This approach is also known as the Blackboard Pattern.

Conclusion

Since Information systems are governed by gravity and the laws of scale they are hard to conquer since it at any crossroad is so much easier to extend something that exists then building something new from scratch. Hard enforcement of physical boundaries using micro-services comes with caveats. One being distributed data management, another being that each micro-service will begin to grow in size as new features are needed and therefore require continuous shepherding and fire extinguishing as the entropy materialises.

The proposed approach is to address this using a data-less service architecture that is supported by a shared data foundation in the same way as agents and environment using the blackboard pattern. This mean to implement an architectural style that builds on the old saying that code ages like fish and data ages like wine.

This is by the way the pattern of the OSDU Data Platform that will be addressed in a later post.

Whats wrong with Microservices?

This is the first post in a longer series on service oriented software architecture. The story begins with a retrospective of a large software project I was part of at the beginning of the century. The task was to implemented a new merchandise software suit for a large European retailer in line with their “Delta” service architecture.

Delta

The Delta service architecture was based on healthy design principles such as encapsulation, autonomy, independent deployment and contracts. The principles had been used on the business level and created nice fine granular, independent services with names like Merchandising Store, Assortment, Promotion, Retail Price, Store Replenishment, each service being responsible for a limited but clearly defined business capability. Remembering correctly there was more than 20 services to be made for the whole suite including buying and selling, representing a functional decomposition of the business.

Figure 1: The Delta Service Architecture

Since all services should be deployed in the same Enterprise Java production environment the team decided on a product line approach, and established a set of principles supported by common components such as the Object Relational Bridge for object persistence, JMS (Java Message Service) for asynchronous contracts processing, and implementation of domain logic using a rich object model guarded by transactional boundaries, an approach that turned out to work reasonable well from a technical point of view. Blueprint shown in figure 2.

Figure 2: Technical architecture anno 2003.

Today some of these choices might look weird, but there was no Cloud, no Spring framework, and no Docker when this was made. The client had in addition made several architectural decisions such as choosing application server, database and message broker, choices that reduced our ability to exploit the technology as we could have by starting out with a open source strategy.

One lesson learned here is, if possible, to avoid premature, political high profile commercial technology decisions. Such decisions always involve senior management as serious money change hands, and at the same time they need to be architectural healthy to stand their time.

Core Domain

The development team was new to the retail domain, and therefore we decided to begin with he simplest service, Retail Store. In retrospect this was a bad decision because it made us begin at the fringe of the domain instead of at the core.

Item is the core of retail. Deciding what items to sell in a particular store is the essence of the retailing business. A can of beer, the six pack and the case of six packs area all items, the same is a bundle of a pizza and a bottle of water. The effect being that there are tens of thousand items in play, some of them are seasonal, others geographical, and others are bundles and promotions such as 3 for 2.

Items can be nested structures organised into categories such as diary, meat, fish, fruit, and beverage. Which items are found in a particular store is defined by store type or format, size, season and geography. A simplified domain model is found in figure 3.

Figure 3: Retail assortment hierarchy from 35000 feet

When the work began we had a high level business service architecture, but we had no domain model showing the main business objects and their relationships to guide the work forward. The effect was that the team learnt the domain the hard way as it dug itself from the edges toward the core.

A fun fact is that the team met Eric Evans when he presented his book on Domain Driven Design in 2004 discovering that we had faced many of the same challenges as him. The difference was that he had been able to articulate those challenges and turn them into a book. Had the book been out earlier we would have been in a better position to ask hard questions related to our own approach.

Learnings

I have identified five major learnings from this endeavour that are relevant for those who considers to use Microservices as architectural style for their enterprise business application. At first glance the idea of small independent services sounds great, but it comes with some caveats and food for thought.

Firstly, a top down business capability based service decomposition without a thoroughly bottom-up analysis of the underpinning domain model is dangerous. In Domain-Driven Design speak this mean that the identification of bounded contexts require a top-dow, bottom-up, middle-out strategic design exercise since business capability and domain model boundaries are seldom the same. Cranking out those boundaries early is crucial for the systems architectural integrity. Its the key to evolution.

Secondly, begin with the core of the domain and work toward the edges. Retail is about the management of items, how to source them, and how to bring them to the appropriate shelves with the correct price given season, geography and campaigns. Beginning with the Retail Store service because it was simple was ok as a technical spike, but not as strategy.

Thirdly, fine granular services leads to exponential connectivity growth and a need to copy data between services. The number of connections in a graph grows according to f(n) = (n(n-1)/2). Therefore 5 services have 10 connections. Doubling to 10 services gives 45 connections, and a doubling to 20 services gives 190 connections and so on. The crux is to understand how many connections must be operational for the system as a whole to work and to balance this out with a healthy highway system providing the required transport capacity and end point management.

Fourthly, the development team was happy when the store service worked, but a single working service at the fringe of the domain does not serve the business. The crucial question to ask is what set of functionality must be present for the system as a whole to be useful? The ugly worst case answer to that is all, including a cross cutting user interface that we leave out for now. The lesson is that Microservices might give developers a perception of speed, but for the business who needs the whole operational the opposite might be the case. Therefore should the operational needs drive the architecture as functional wholes must be put into production.

Fifthly, the service architecture led to a distributed and fragmented domain model since service boundaries was not aligned with the underpinning domain model seen in figure 3. Price, Assortment and Promotion has the same data foundation and share 80% of the logic that we ended up replicating across those services.

To sum it all up, understand the whole before the parts and then carefully slice the whole into cohesive modules with well defined boundaries remembering that the business make their money from an operational whole, not from fragmented services that was easy to build.

Microservices

Microservices is an architectural style introduced around 2013 that promotes small autonomous services that work together, modelled around a business domain and supported by a set of principles or properties such as culture of automation, hide implementation details, decentralise all the things, independent deployment, consumer first, isolate failure, principles that are difficult to argue against, while a literal interpretation might cause more harm than needed.

Philosophically Microservice follows the principles of Cartesian reductionism, as did Lord Nelson in his divide and conquer strategy. The big difference, Lord Nelson’s task was to dismantle the French fleet, not to build a new fleet from the rubbles, and this difference coins IMHO the major challenge with the Microservice style. Its aimed at independent development and deployment of the parts pushing the assembly of the whole to operations. Some might argue that its then fixed by the DevOps model, but if there are 20 services supported by 20 teams the coordination problem is invitable.

Conclusion

Service oriented architectures and the Microservice architectural style offers opportunities for those who need independent deployment. For applications who do not need independent deployment a more cohesive or monolitic deployment approach might be better. Independent of style, the crux is to get the partitioning of the domain right at design time and in operations. The key question to answer is what must be operational as a functional whole?

This mean that the design time boundaries and the operational boundaries are not identical and for a solution to be successful the operational boundary is the most important. That said, to secure healthy operational boundaries, the internals of the system need to be well designed. Approaching a large complex domain with transactional scripts will most likely create problems.

In the next post the plan is to address how data management can be moved out of the functional services enabling data less services along the lines that data ages as wine, while software ages as fish …

See you all next time, any comments and questions are more than welcome.

Microservices and the role of Domain-Driven Design

In our #SATURN15 talk From Monolith to Microservices we addressed the challenge of data centric development, particularly when behaviour rich domain models are needed.

One of our main point in the talk was that too many developers continued with their script like programming style when they moved to Object-Oriented programming languages. Objects was treated as records and they seamed to have forgotten or never learned that object-oriented programming is all about capture of domain  behaviour and knowledge.

After reading the introductory chapter of @VaughnVernon book Implementing Domain-Driven Design this weekend another aspect became evident. The negative influence of properties and property sheets, originally introduced by Microsofts Visual Basic in 1991 and later copied by the JavaBean specification. These innovations dumbed objects down to records and even worse, trained developers to think this was the right way to design software using objects.

For Microservices to survive it is time to take object-oriented modelling back. Developers must learn that objects and object oriented programming supported by domain-driven design provides the tooling and techniques required to build behaviour rich software.  Software that not only capture data, but also domain behaviour and knowledge and make it executable.

The claim is that Microservices without sufficient capture of rich domain behaviour and knowledge will not add sufficient business value. They will just end up as distributed balls of mud.